Synergy Compute Nodes (SCN)
Power, Heat and Infrastructure Partnership Screening Brief
Illustrative pre-feasibility screen | September 2026
Executive Summary. Use synergies among power generation, data-center heat demand, storage/backup and infrastructure that a partner or community already needs to improve total economics and deliver visible local value. The intent is to show what is possible through engineering, deliberate site selection and partnerships, not to infer one standard design. Power assets can serve multiple purposes, rejected heat can become a saleable product, existing backup infrastructure can avoid duplicate capital, and required infrastructure such as dams, conduits, pipelines or district-energy loops can support both community and compute needs. These dual-role benefits may reduce lifecycle cost while creating positive community impacts that help address siting and development opposition. |
Important: This is a preliminary screening brief based on AI-assisted research and public-source benchmarks, not an investment-grade feasibility study. Cost ranges combine published benchmarks with stated modeling assumptions. Site-specific engineering, utility tariffs, permits, taxes, financing and partner terms can materially change the result.
Power-cost and heat-reuse comparison
Benchmarks and ranked options
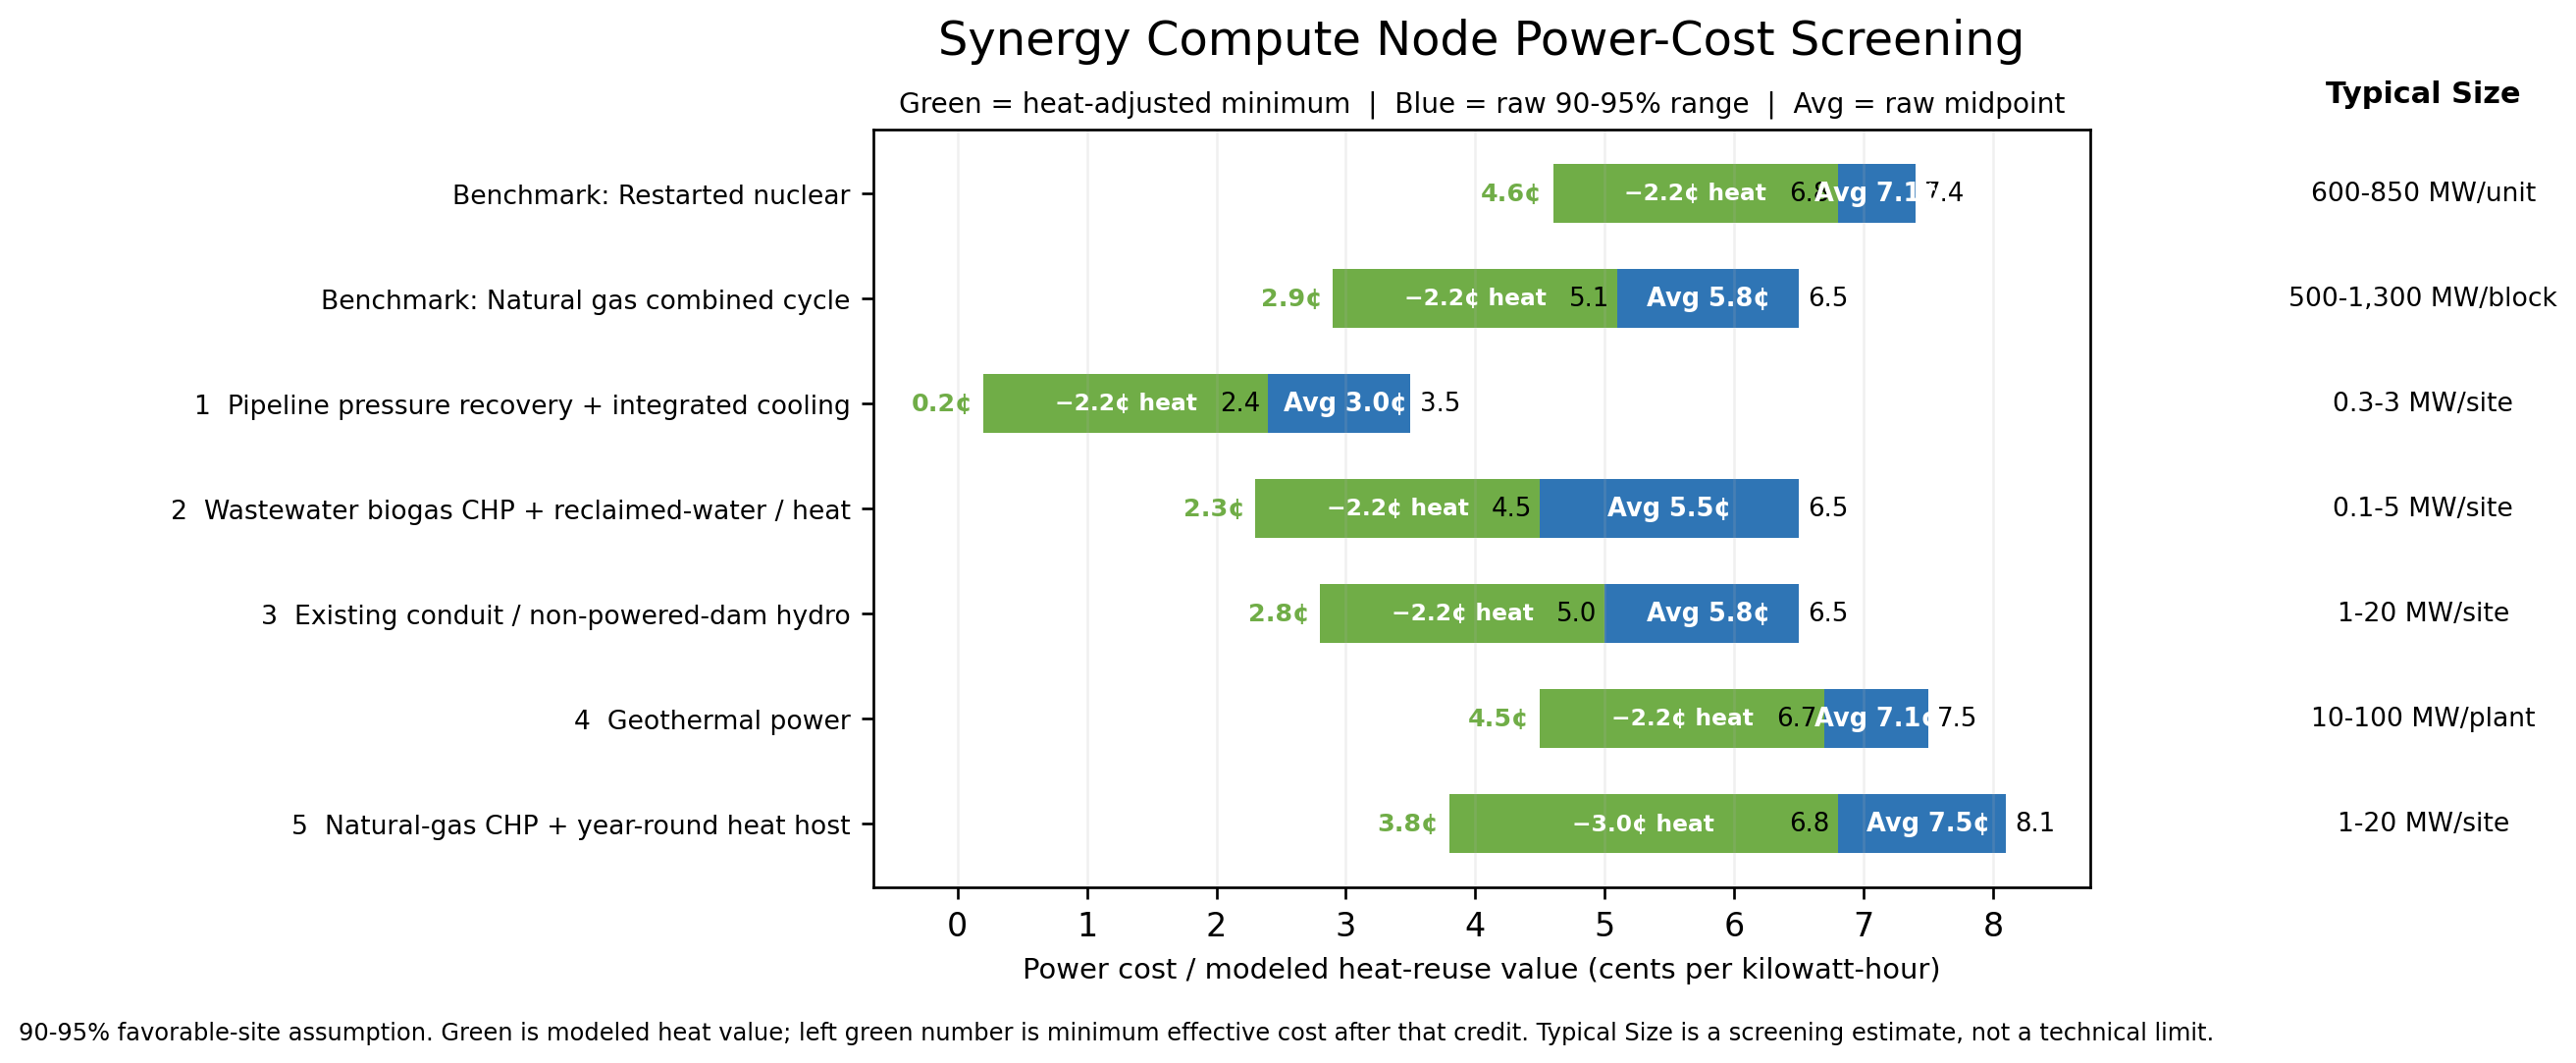
Benchmarks are shown first and exclude heat reuse in their underlying power-cost estimates. Options are ordered by average pre-heat power cost. Blue shows the 90-95% favorable-site raw power-cost range; the green section extends left to show modeled heat-reuse value. The green number at the far left is the resulting minimum effective cost after that heat credit. The Size column is an estimated typical generation range for a favorable host site or project, not a technical maximum. Costs are shown in cents per kilowatt-hour (¢/kWh).
Benchmark configuration | 90-95% favorable-site benchmark cost
(cents/kWh) | Average / heat value / after-heat average
(cents/kWh) | Illustrative 20% heat-partner incentive | Why it matters |
Benchmark: Restarted nuclear | 6.8-7.4 modeled around 7.1 avg | 7.1 avg / 2.2 heat / 4.9 after heat | $500k-$650k/yr per 10 MW heat host | Firm low-carbon benchmark that leverages an existing generation site and interconnection rather than a greenfield build. Heat reuse is a separate SCN overlay, not part of the restart benchmark. |
Benchmark: Natural gas combined cycle | 5.1-6.5 | 5.8 avg / 2.2 heat / 3.6 after heat | $500k-$650k/yr per 10 MW heat host | Firm generation benchmark under favorable gas/capital assumptions. Heat reuse is modeled separately through the data center rather than assumed in the generation benchmark. |
Options ordered by average pre-heat power cost
Option / configuration | 90-95% favorable-site raw power cost
(cents/kWh) | Average / heat value / after-heat average
(cents/kWh) | Illustrative 20% partner incentive | Key synergies | Commercial screen / constraint |
1. Natural-gas pipeline pressure recovery + integrated cooling | 2.4-3.5 | 3.0 avg / 2.2 heat / 0.8 after heat | $1,200k-$1,810k/yr total: power host + heat host | Uses pressure drop that would otherwise be dissipated. Current systems can also create useful cooling; server heat can be sold to a separate nearby host. | Strong upside at the right pressure-regulation site. Integrated data-center deployments are early and typically smaller than hyperscale campuses. |
2. Wastewater biogas combined heat and power (CHP) + reclaimed-water / heat partnership | 4.5-6.5 | 5.5 avg / 2.2 heat / 3.3 after heat | $180k-$790k/yr per 10 MW equivalent; usually smaller projects | Uses waste fuel, CHP heat, possible reclaimed-water cooling and municipal infrastructure. The chart conservatively credits only the common data-center heat overlay, not additional CHP/process-heat upside. | Strong circular-economy/community story, but biogas resource usually limits scale. Best for smaller compute nodes. |
3. Existing conduit / non-powered-dam hydro | 5.0-6.5 | 5.8 avg / 2.2 heat / 3.6 after heat | $680k-$1,350k/yr total: power/infrastructure + heat host | Uses existing water infrastructure and can create revenue/avoided cost for the water-system owner; server heat can serve a nearby host. | Long-lived, low-carbon and mature. Highly site- and scale-constrained; water rights and hydrology are decisive. |
4. Geothermal power | 6.7-7.5 | 7.1 avg / 2.2 heat / 4.9 after heat | $500k-$650k/yr per 10 MW heat host | Firm low-carbon power plus separate sale/reuse of server heat; grid and normal standby remain backup. | Strong firm-power option where geology, drilling risk and interconnection are favorable. |
5. Natural-gas CHP + year-round heat host | 6.8-8.1 | 7.5 avg / 3.0 CHP heat / 4.5 after heat | $550k-$620k/yr per 10 MW heat host | Existing grid, uninterruptible power supply (UPS) and emergency generator remain backup. Higher-grade engine heat is saleable; one fuel stream serves power + heat. | Mature, dispatchable and scalable. Best near a dense thermal load. Fuel price, emissions and permitting remain constraints. |
Heat-value overlay: Min and Max labels at the blue-bar edges are the raw-generation cost bounds, Avg is the raw midpoint, and the far-left green number is the minimum raw cost after the modeled heat credit. The common 2.2¢/kWh heat value represents modeled project-retained value from low-temperature data-center heat after reserving 20% of avoided heat cost to the heat customer, before heat-loop capital and operations and maintenance (O&M). Natural-gas combined heat and power (CHP) uses a higher 3.0¢/kWh screening credit because engine jacket-water and exhaust heat are hotter and can displace higher-grade boiler heat with less temperature lift. That 3.0¢ premium is a modeling assumption, not a universal market average.
1. Existing UPS and emergency generation are baseline data-center infrastructure, so we did not charge them again to SCN unless a concept requires additional capacity or routine operation.
2. Lithium-ion battery energy storage systems (BESS) should be treated only as incremental short-duration balancing where needed; current screening is roughly $270-$365/kWh installed with augmentation/replacement expected over a multi-decade site life.
3. For thermal balancing, store heat as heat: hot-water thermal storage plus the heat customer's existing boiler/CHP is generally preferable to buying electrical storage for a thermal problem. |
Benchmarks and option summaries
Benchmark: Restarted nuclear
Lazard's 2026 report provides an illustrative restart midpoint near $71/megawatt-hour (MWh). For charting, this brief retains the prior 6.8-7.4¢/kWh screening band around that 7.1¢/kWh midpoint; the band is a modeling range, not a quoted Lazard range. That benchmark does not assume heat reuse. The chart adds a separate 2.2¢/kWh average data-center heat-reuse overlay, yielding about 4.9¢/kWh after the modeled heat value before heat-loop capital and O&M. The concept is to partner around an existing or restarted generation site and interconnection, then treat server heat as a separate community/customer asset. Restart opportunities are rare, site-specific and dependent on licensing, transmission, commercial structure and schedule. Typical size: ~600-850 MW per restarted unit, based on current U.S. restart projects. [1,3,14]
Benchmark: Natural gas combined cycle
Lazard's 2026 natural-gas combined-cycle range provides the raw firm-power benchmark used here and does not assume heat reuse. The chart uses the 5.8¢/kWh midpoint, then shows the separate 2.2¢/kWh data-center heat value, yielding about 3.6¢/kWh after the modeled heat overlay before heat-loop capital and O&M. This is a comparison benchmark, not a claim that a greenfield plant is the preferred data-center architecture. Typical size: ~500-1,300 MW per combined-cycle block. [1,3,5,15]
1. Natural-gas pipeline pressure recovery + integrated cooling
Turboexpanders can replace part of the throttling function at gas pressure-reduction stations and recover pressure energy as electricity. Published work reports very low generation cost in favorable pressure-station cases, while a 2026 Sapphire Technologies / Anax Power announcement describes an integrated power-and-cooling system for distributed data centers. The chart uses the 3.0¢/kWh raw midpoint and overlays the common 2.2¢/kWh server-heat value, producing an illustrative 0.8¢/kWh after-heat figure before heat-loop capital/O&M and without monetizing cooling. The $1,200k-$1,810k/yr total partner incentive combines the previously modeled power-host share with the separate $500k-$650k/yr heat-host savings. Pressure/flow, maintenance, gas-service reliability and actual scale must be verified. Typical size: ~0.3-3 MW per site; the 0.3-MW modules can be paralleled, so this is a screening estimate rather than a vendor-stated site limit. [8,9,16]
2. Wastewater biogas CHP + reclaimed-water / heat partnership
U.S. Department of Energy (DOE) guidance documents biogas CHP at wastewater treatment plants, and a 2026 peer-reviewed assessment provides updated techno-economic context. The SCN model layers together waste-derived fuel, useful CHP heat, possible reclaimed-water cooling and municipal infrastructure. The chart conservatively overlays only the common 2.2¢/kWh data-center heat value on the 5.5¢/kWh average generation screen, rather than adding a second credit for CHP/process heat. The $180k-$790k/yr partner range remains the prior combined power/infrastructure-and-heat screening estimate at a 10 MW-equivalent reference; actual projects are often smaller because biogas supply limits scale. Typical size: ~0.1-5 MW per site; DOE reports a 3.3-MW average and more than half of wastewater CHP sites below 1 MW. [10,13]
3. Existing conduit / non-powered-dam hydro
U.S. Department of Energy (DOE) assessments emphasize that conduit hydro can use existing water pipelines, canals and other man-made structures, avoiding a new dam or reservoir and creating value for the water-system owner. The U.S. Energy Information Administration (EIA) and DOE hydropower reports provide mature-generation cost context. The chart uses the 5.8¢/kWh midpoint and overlays the common 2.2¢/kWh server-heat value. The $680k-$1,350k/yr total partner incentive combines approximately $180k-$700k/yr of modeled power/infrastructure savings with $500k-$650k/yr of heat-host savings at a 10 MW reference. Typical favorable-site size: ~1-20 MW; DOE's non-powered-dam development pipeline averaged 12 MW, with a much wider reported range. [6,7,12]
4. Geothermal power
Lazard's 2026 unsubsidized geothermal range provides the raw generation basis, with the favorable end used because this brief explicitly assumes 90-95% favorable site selection. Geothermal is attractive because output can be firm rather than weather-driven. The chart uses the 7.1¢/kWh midpoint and separately overlays the common 2.2¢/kWh data-center heat value. The economics depend heavily on geology, drilling risk, resource temperature, interconnection and development schedule. Typical size: ~10-100 MW per plant. [1,3,17]
5. Natural-gas CHP + year-round heat host
DOE's reciprocating-engine fact sheet shows mature multi-megawatt CHP equipment with roughly 40% electrical efficiency and about 79% total CHP efficiency in representative configurations. The chart uses the 7.5¢/kWh raw midpoint and a 3.0¢/kWh average credit from higher-grade recoverable engine heat, rather than stacking a second server-heat credit. Unlike lower-temperature server heat, engine jacket-water and exhaust heat can often serve hotter thermal loads directly; the 3.0¢/kWh value remains a screening assumption, not a universal market premium. The resulting 4.5¢/kWh after-heat figure is illustrative and precedes site-specific heat-loop capital/O&M. The $550k-$620k/yr partner incentive represents the reserved 20% customer savings in the modeled heat relationship. This option is strongest beside a dense, year-round thermal load. Typical size: ~1-20 MW per site using modular engines; individual CHP engines span up to 10 MW and can be paralleled. [2,5]
Application Recommendations
This brief does not infer selecting a technology in the abstract. Rather, candidate data-center sites should be screened for combinations of: a power resource or recoverable-energy stream; partner infrastructure that must be built or maintained anyway; a nearby year-round heat customer; grid/fuel constraints; short-duration balancing needs; and a measurable community benefit.
Advance the strongest site only after building a site-specific cash-flow model and validating engineering, permitting, interconnection, reliability and partnership terms. Preserve separate economics for the data-center project, the infrastructure partner and the heat customer so benefits are not double-counted.
First-pass site data: planned MW; utility tariff and interconnection status; gas pressure/flow and delivered price; nearby municipal/industrial heat users; water/wastewater systems; dams/conduits/pressure-regulation assets; cooling architecture; existing UPS/emergency-generation design; and the local development or infrastructure problem a partnership could help solve.
Screening assumptions
90-95% optimal site selection means a deliberately favorable U.S. site for the technology and partnership: strong resource, suitable interconnection/fuel access and a nearby partner whose infrastructure or heat demand is real. It is a design assumption, not a statistical percentile claim.
Power costs are approximate unsubsidized or pre-incentive screening economics unless otherwise noted. Published levelized cost of energy (LCOE) datasets are not perfectly comparable because technologies have different firmness, financing, permitting and site assumptions.
A grid-connected data center is assumed to retain the UPS and emergency generation normally required for reliability. Those baseline costs are not charged again. Only incremental balancing required by a specific architecture is compared against the baseline.
Standard heat overlay: 10 MW information-technology (IT) node, power usage effectiveness (PUE) of 1.20, direct low-temperature heat use without a heat pump, 70-80% of IT heat useful/saleable, and a heat customer otherwise using a 90%-efficient natural-gas boiler. Heat is sold at 80% of the customer's avoided cost, reserving 20% of savings to the heat partner.
That standard overlay produces about $500k-$650k/yr of heat-partner savings per 10 MW IT node and an average project-retained heat value of about 2.2¢/kWh before heat-loop capital/O&M. Natural-gas CHP uses a separate ~3.0¢/kWh average engine-heat value. Partner incentives for shared power infrastructure are modeled separately at 20% of defensible gross savings.
Endnotes
1. Lazard, 2026 Levelized Cost of Energy+ (LCOE v19.0) - source |
2. U.S. DOE Better Buildings, CHP Technologies: Reciprocating Engines - source |
3. U.S. DOE, Best Practices Guide for Energy-Efficient Data Center Design, heat reuse section - source |
4. U.S. EIA, July 2026 electricity prices by state and sector - source |
5. U.S. EIA, 2026 commercial natural-gas prices - source |
6. U.S. DOE, conduit hydropower assessment - source |
7. U.S. EIA, AEO 2026 Levelized Costs of New Generation Resources - source |
8. Sapphire Technologies / Anax Power, integrated pressure-recovery power and cooling for data centers - source |
9. Ebrahimi Saryazdi et al., natural-gas pressure-recovery turboexpander economics - source |
10. U.S. DOE Better Buildings, CHP Market Sector: Wastewater Treatment Plants - source |
11. Annual Technology Baseline, utility-scale battery storage - source |
12. U.S. DOE, 2023 Hydropower Market Report, canal/conduit costs - source |
13. Duarte et al., 2026 wastewater-biogas CHP techno-economic assessment - source |
14. Current U.S. nuclear-restart size examples: Duane Arnold 615 MW; Palisades 800 MW; Crane 835 MW - source 1 / source 2 / source 3 |
15. U.S. EIA, natural-gas combined-cycle power-block sizes (about 500 MW historically; >700 MW recent average; 1,259 MW large block example) - source |
16. Sapphire Technologies, FreeSpin in-line turboexpander: 300 kW maximum per current module; modules may be installed in parallel - source 1 / source 2 |
17. U.S. DOE/EERE, geothermal plant size categories: 10-50 MW medium and 50-100+ MW large - source |